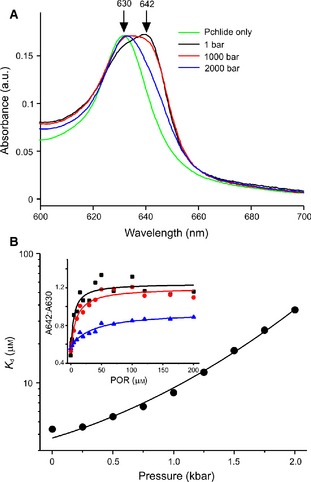
Figure 3.

Pressure dependence of the ternary enzyme–substrate formation for POR. (A) Absorption spectra of the ternary complex formed from 7 μm Pchlide, 200 μm NADPH and 100 μm POR measured at 1 bar, 1 kbar and 2 kbar. Spectra were taken at room temperature and are compared with that of Pchlide measured at 1 bar. The arrows show the peak maxima for Pchlide and the red‐shift due to formation of the ternary complex. (B) The pressure dependence of the K d for Pchlide. The data were fitted to Eqn (5) in the Materials and methods. (Inset) The level of ternary complex formation as a function of POR concentration at 1 bar (black), 1 kbar (red) and 2 kbar (blue). The data were fitted to a hyperbolic function to determine apparent K d values.
