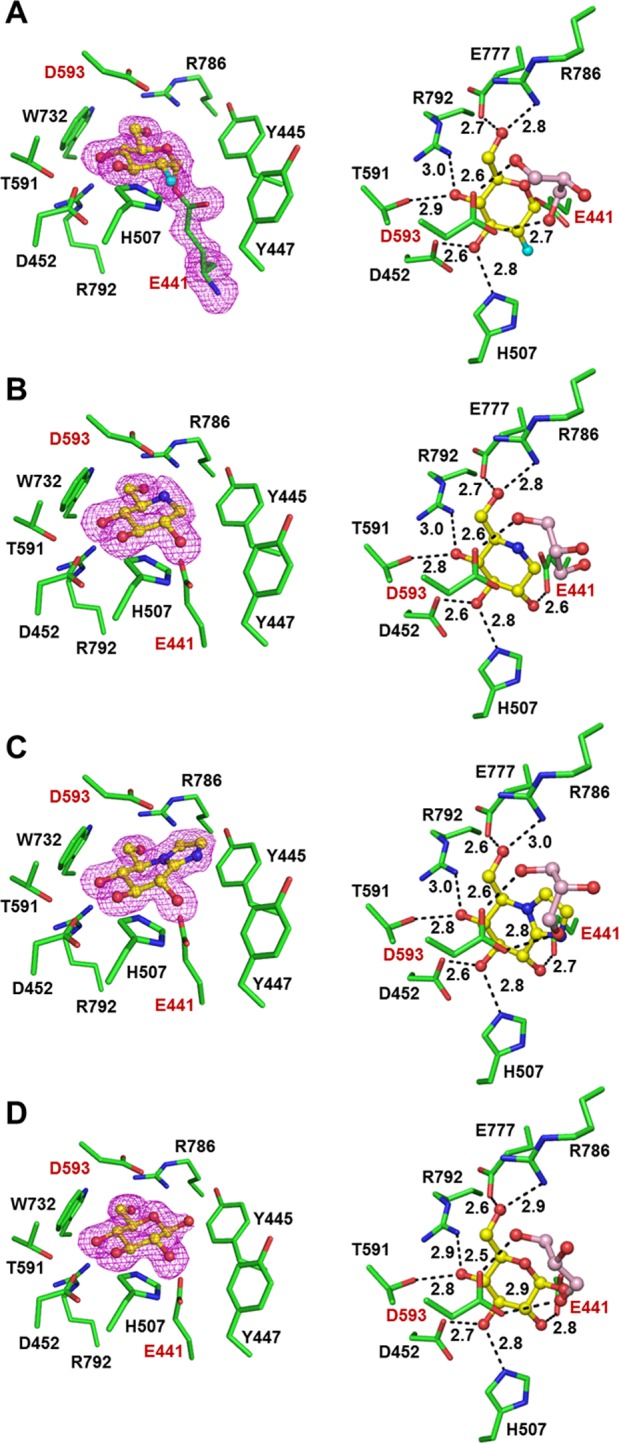
Figure 2.

Active site of TxGH116 alone and in complex with inhibitors and glucose. Left panels show the ligand electron density omit maps, contoured at 3σ, in the active sites of the complexes; the right panels show the potential hydrogen bonds between the ligands and surrounding residues, with the distances between the interacting atoms displayed. A glycerol molecule that was omitted from the left panels for clarity is shown in the right panels; catalytic residues are labeled in red. Ligands include (A) 2-deoxy-2-fluoroglucosyl (G2F), (B) deoxynojirimycin (DNJ), (C) glucoimidazole (GIM), and (D) β-d-glucose. Distances are in Å.
