
Figure 1.
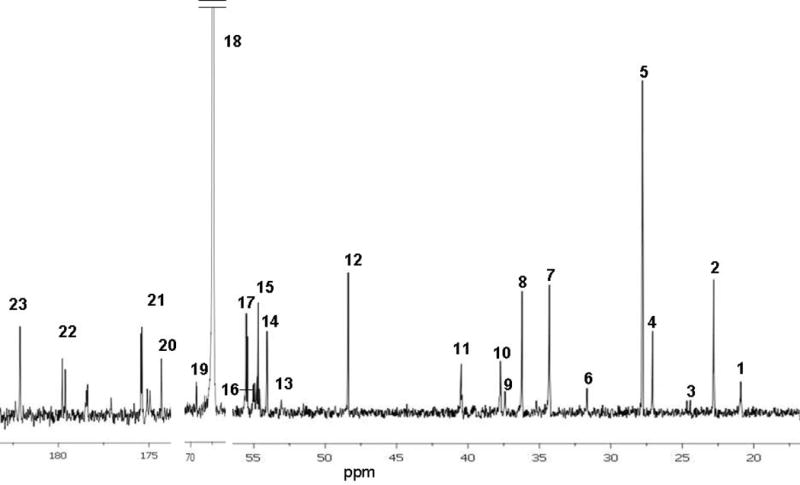
A typical 13C-NMR spectrum of metabolites in brain 120 min after intraperitoneal injection of [2-13C]acetyl-L-carnitine. The numbers for labeled peaks correspond to: 1, Lactate C3; 2, N-acetyl aspartate C6; 3, GABA C3; 4, glutamine C3; 5, glutamate C3; 6, glutamine C4; 7, glutamate C4; 8, GABA C2; 9, taurine C2; 10, aspartate C3; 11, GABA C4; 12, taurine C1; 13, aspartate C2; 14, N-acetyl aspartate C2; 15, creatine C2; 16, glutamine C2; 17, glutamate C2; 18, dioxane (internal standard); 19, lactate C2; 20, glutamine C1; 21, glutamate C1; 22. glutamine C5; 23, glutamate C5. Alanine C3 was observed in some, but not all spectra. Spectrum was obtained as described in methods. Details of the labeling are given in results section.