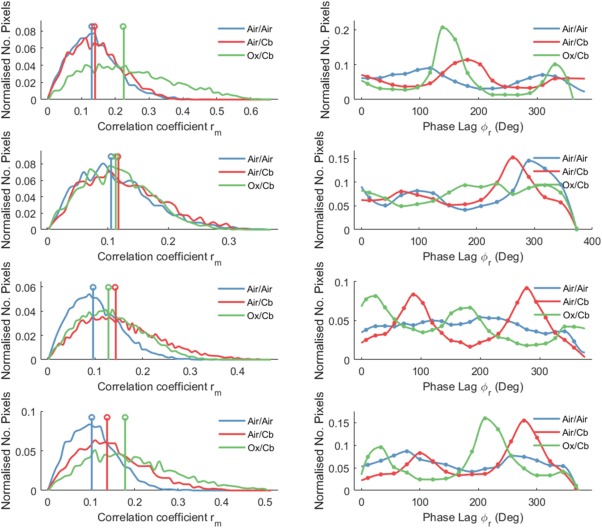
Figure 3.

BOLD vasomotor response in four representative volunteers breathing “carbogen‐light” (1–2) and carbogen (3–4) interleaved with air and oxygen, relative to an air‐only control state. Left column: Histograms of correlation coefficients within healthy breast parenchyma. Right column: Histograms showing distribution of phase lags at which maximum correlation occurred.
