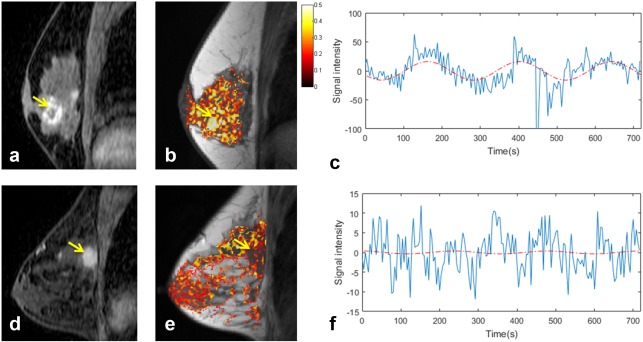
Figure 5.

BOLD response to oxygen vs. 5% carbogen stimulus in two patients with (top row) 2.6 cm grade 1 mucinous carcinoma and (bottom row) 2.3 cm grade 3 invasive ductal carcinoma: a,d: reformatted sagittal postcontrast enhanced images, yellow arrow denotes tumor; b,e: correlation coefficient maps superimposed on T 1‐weighted anatomical image; c,f: signal modulation extracted from tumor ROI, with best‐fit sinusoids at the stimulus frequency (phase shifted to match the time lag of response and normalized to the amplitude of response) overlaid in red.
