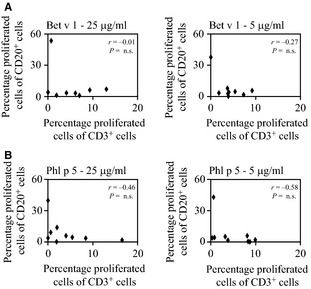
Figure 3.

Correlation of allergen‐specific T‐ and B‐cell proliferation. Scatter plots of T‐ (x‐axes) and B (y‐axes)‐cell proliferations as measured by CFSE dilution in response to stimulation with 25 (left) or 5 (right) μg/ml of (A) Bet v 1 (B) Phl p 5. Results are displayed as percentage of proliferated cells of CD3+ or CD20+ cells, respectively. Experiments were performed in triplicates in nine allergic patients (#3, 5, 7, 8, 10–14), and the mean values are displayed.
