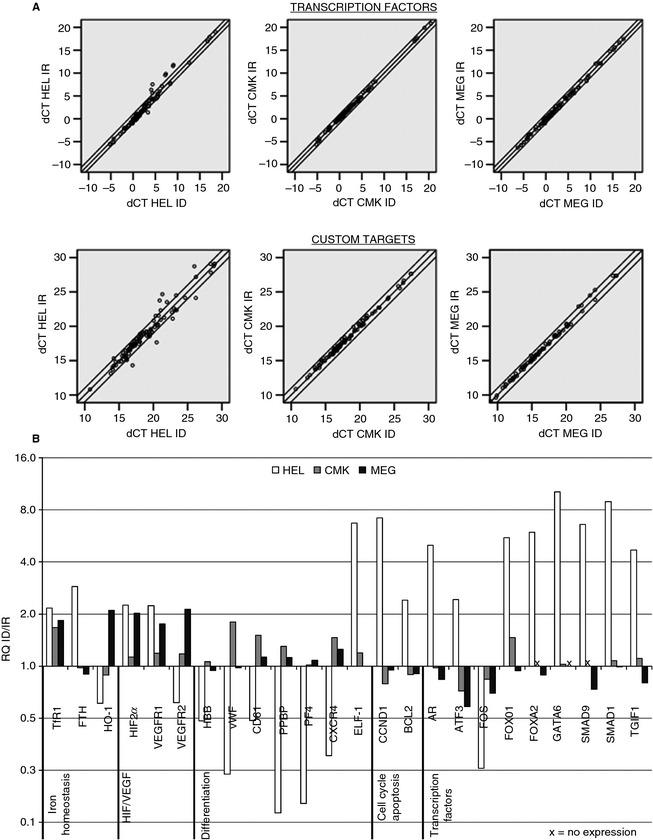
Figure 4.

Iron deficiency (ID) alters gene expression. Real‐time quantitative PCR analysis of custom targets and transcription factors in HEL, CMK, and megakaryocytes (MEGs) after 1, 2, and 5 days of culture, respectively. (A) Iron‐replete (IR) ΔC t plotted against the ID ΔC t of HEL, CMK, and MEGs after analysis of transcription factors and custom targets gene expression. Double lines represent thresholds of 0.5 and 2.0. (B) Relative mRNA quantity of genes that reached the set cutoffs of 0.5‐ and 2.0‐fold changes in at least one cell type under ID. Genes that were not detected are marked with x. Data were obtained from samples pooled from two or three independent experiments. FOV indicates field of view.
