Figure 7.

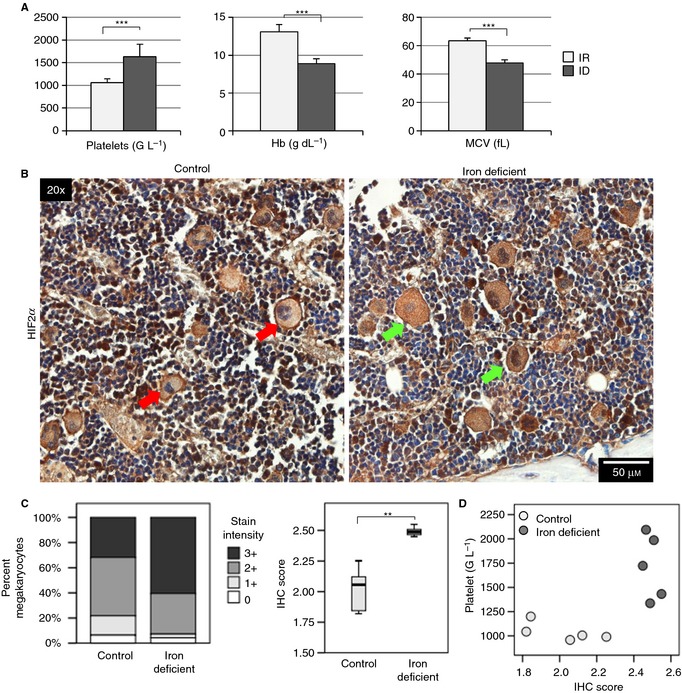
HIF2α expression is increased in iron‐deficient (ID) bone marrow megakaryocytes. (A) Platelet count, hemoglobin (Hb), and mean corpuscular volume (MCV) of control (n = 7) and iron‐deficient (n = 8) rats after 3 weeks. Analysis was performed on a Cell‐Dyn 3500 analyzer. (B) Representative images of bone marrow IHC for HIF2α from control and iron‐deficient rats. Red arrows depict megakaryocytes in control mice with less‐intense HIF2α staining, and green arrows depict megakaryocytes in ID mice with more‐intense staining. (C) Percentage of total control (n = 1735) and iron‐deficient (n = 1621) bone marrow megakaryocytes under each staining intensity and the median calculated IHC score for control (n = 5) and iron‐deficient (n = 5) rats. (D) Scatterplots of platelet count against IHC score. ***P ≤ 0.001. FOV indicates field of view.
