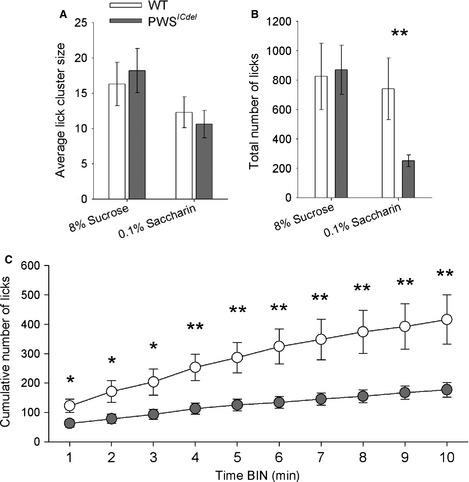
Figure 3.

Lick‐cluster analysis (LCA) showing hedonic response to caloric (8% sucrose) and non‐caloric (0.1% saccharin) tastants in wild‐type (WT) and Prader–Willi syndrome (PWS)ICdel mice. (A) Although there is a general difference between sucrose and saccharin in lick‐cluster size (LCS), again there is no difference between WT and PWS ICdel mice, suggesting that perceived palatability is the same for both genotypes. (B) However, consumption of saccharin, as measured by total number of licks, is significantly reduced in PWS ICdel mice and WT controls. There is no difference between WT and PWS ICdel mice in total number of licks with 8% sucrose. (C) Analysis of cumulative lick data binned across the first 10 min of testing revealed that this reduced motivation for saccharin seen in PWS ICdel mice is present throughout the duration of the session (asterisks relate to post hoc comparisons). Data shown are mean ± SEM (GENOTYPE, *P < 0.05, **P < 0.01).
