
Figure 7.
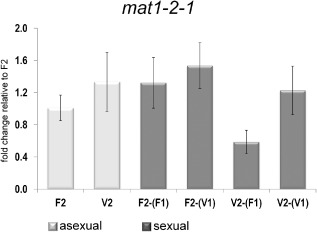
Analysis of mat1‐2‐1 transcript levels. Transcript abundance is shown upon growth on malt extract agar plates at subjective noon as analyzed by qRT‐PCR for both mating types of analyzed strains. Sample codes are summarized in Fig. 6. Regulation of mat1‐2‐1 under asexual conditions in wild type (F2) and Δvel1 F 2 (V2) along with regulation of mat1‐2‐1 upon encounter of the compatible wild‐type (F1) or Δvel1 F 1 (V1) mating partner under sexual conditions in wild type [F2 crossed with (F1)] and strains lacking vel1 [V2 crossed with (F1) or V2 crossed with (V1)]. Transcript levels between sexual and asexual conditions are not significantly different for the wild type [F2 vs. F2‐(F1)]. Only in Δvel1 F 2 upon encounter of the wild type [V2‐(F1)] mat1‐2‐1 is significantly downregulated compared with all other samples. Pooled samples from several plates and two independent biological replicates were considered. Statistical significance of differences was evaluated with the software qbase+ and applying analysis of variance with a P‐value threshold of < 0.05. Error bars show standard deviations. Contamination of total RNA of one sample with that of the respective mating partner on the same plate was determined to be below 1.02%.