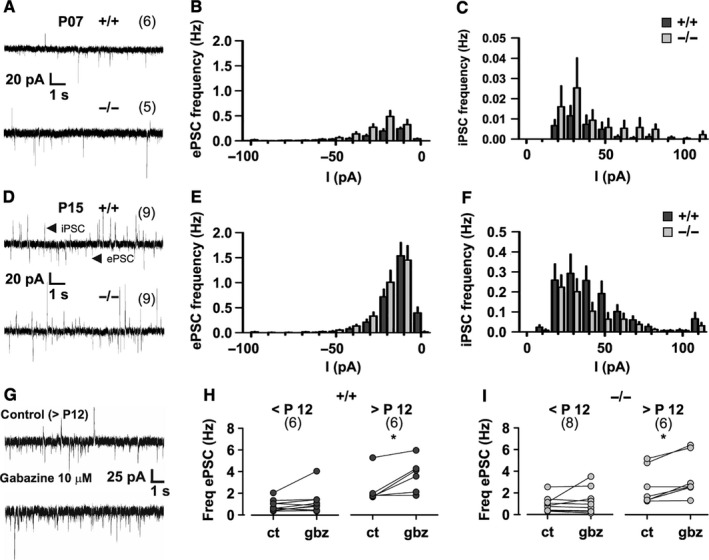
Figure 1.

Spontaneous excitatory and inhibitory postsynaptic currents (ePSCs and iPSCs) in young Purkinje neurons from wildtype (+/+) and lethargic (−/−) mice. (A, D) Representative recordings from P07 and P15 mice show ePSCs and iPSCs as inward and outward current spikes, respectively. (B, C, E, F) Graphs depicting ePSC and iPSC amplitude and frequency in P07 (B, C) and P15 mice (E, F). (G) iPSCs and ePSCs in control conditions, and in the presence of gabazine; note the absence of iPSCs after gabazine application. (H, I) Mean ePSC frequency in paired recordings before and after gabazine application in +/+ (H) and −/− (I) mice. Note the significant increase in ePSC frequency in both +/+ and −/− mice after P12. Bar graphs indicate mean ± SEM; anova tests were used for comparison of amplitude and frequency as detailed in Table 1. A paired t‐test was used in H and I; *P < 0.05. Numbers of independent samples are indicated in parentheses in the figure.
