Figure 3.

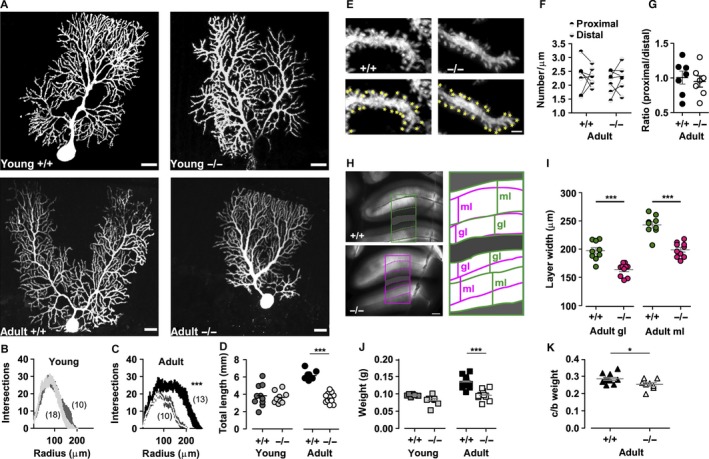
Morphological analysis of Purkinje neurons, granular and molecular layers. (A) Purkinje neurons of juvenile and adult wildtype (+/+) and lethargic (−/−) mice, perfused with biocytin during patch‐clamp recording and subsequently fluorescently labelled and analysed with confocal microscopy. Scale bars = 20 μm. (B, C) Graphs of the number of radial intersections of dendrites at increasing distance from the soma (Scholl analysis) in young (B) and adult (C) +/+ and −/− mice. Note the significantly diminished branching of adult −/− PCs. (D) Total dendritic length is significantly increased in dendrites in adult +/+ PCs. (E) High‐magnification images of PC dendrite segments in +/+ and −/− mice with dendritic spines highlighted by yellow marks (lower panels). Scale bar = 1.5 μm. (F) Average spine density in proximal and distal dendritic segments in adult +/+ and −/− neurons; paired measurements in each cell are connected by lines. (G) Ratio between proximal and distal spine density. (H) Brightfield images of acute cerebellar slices from adult +/+ and −/− mice. Scale bar = 250 μm. Masks outlining the granular and molecular layers are expanded and superimposed in the right panel. (I) Average width of adult +/+ and adult −/− granular and molecular layers. Note that both granular and molecular layers are significantly narrower in the cerebellar cortex of −/− mice. (J) Cerebellar weight of young +/+ (dark grey) and young −/− (light grey), adult +/+ (black) and adult −/− (white) mice. (K) Ratio between cerebellum and brain weight (c/b) in adult +/+ (black) and adult −/− (white) mice. Differences in dendritic branching (B, C) were analysed with two‐way anova and numbers of independent samples are indicated in parentheses. Differences between multiple populations were analysed with one‐way anova followed by Bonferroni post‐test (D, F, J, I). A Mann–Whitney test was used in the comparison between adult cerebellum/brain weight ratio and proximal/distal spine ratio (G, K). *P < 0.05, ***P < 0.0001.
