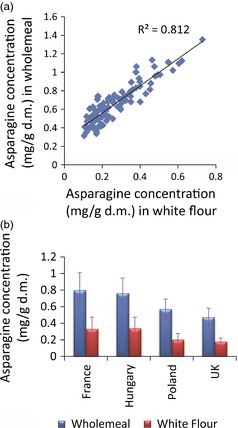
Figure 5.

Comparison of asparagine concentration (mg/g d.m.) in white flour and wholemeal samples grown at 4 locations (France, Hungary, UK and Poland) in 2007. (a) correlation of asparagine concentrations (mg/g d.m.) in white flours against wholemeals; (b) mean levels of measured asparagine concentration in white flour and wholemeal samples from each of 4 growing locations. Error bars represent standard deviation of 3 replicate samples.
