
Figure 4.
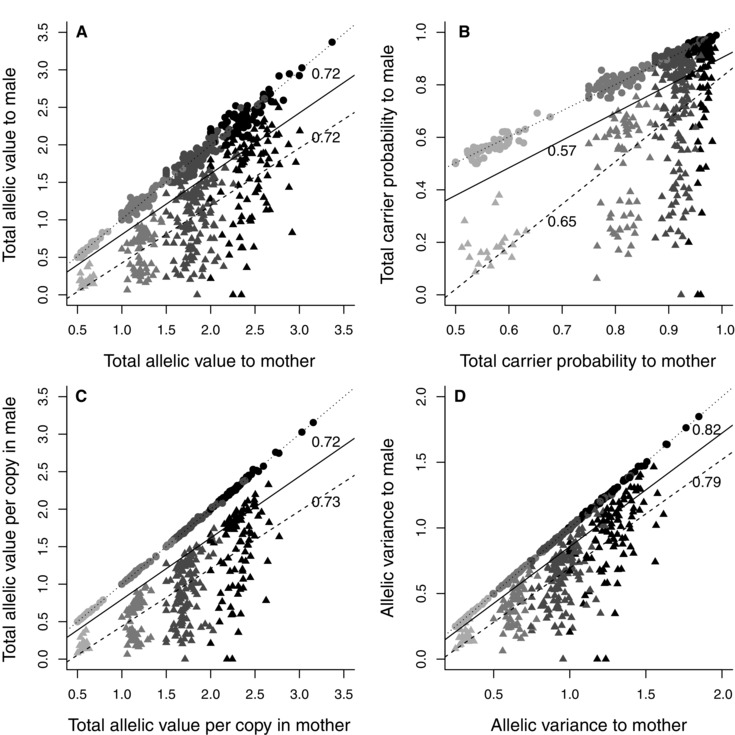
Relationships between the total (A) allelic value, (B) carrier probability, (C) allelic value per copy in each focal adult, and (D) allelic variance of an observed brood relative to its mother versus her socially‐paired male. Points and triangles denote observed WPO‐broods (N = 420) and EPO‐broods (N = 321), respectively. Black, dark‐gray, mid‐gray, and light‐gray symbols denote brood sizes of four, three, two, and one chick, respectively. Solid, dotted, and dashed lines depict linear regressions fitted through all observed broods, WPO‐broods and EPO‐broods, respectively. Pearson's correlation coefficients calculated across all broods and EPO‐broods are adjacent to regression lines. Correlations were 0.99 across WPO‐broods.