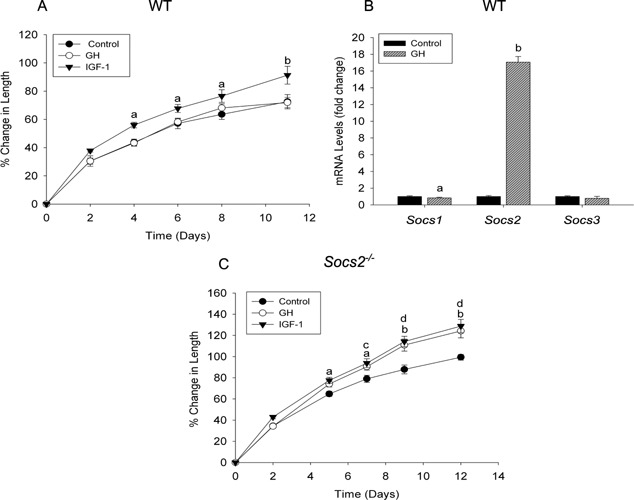
Figure 1.

SOCS2 regulation of GH‐induced embryonic metatarsal growth. Graphs showing (A) WT and (C) Socs2‐/‐ E17 metatarsal growth in response to GH or IGF‐1 (100 ng/ml) over a 12 day period. Data are presented as mean ± SEM. Significance denoted by IGF‐1 versus control a P < 0.05, b P < 0.001. GH versus control c P < 0.05, d P < 0.001, (n ≥ 6). (B) Transcript analysis of Socs1, 2, and 3 in WT metatarsals following 7 days GH (100 ng/ml) treatment. Data represented as means ± SEM. Significance from untreated metatarsals denoted by a P < 0.05, b P < 0.01, (n = 3).
