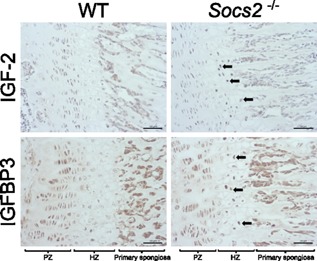
Figure 3.

Immunohistochemical localization of IGF‐2 and IGFBP3 to the proliferating and hypertrophic chondrocytes of WT and Socs2‐/‐ growth plates. In contrast to WT growth plates, hypertrophic chondrocytes within the Socs2‐/‐ growth plate expressed high levels of both IGF‐2 and IGFBP3 (arrows). Scale bars = 50μm
