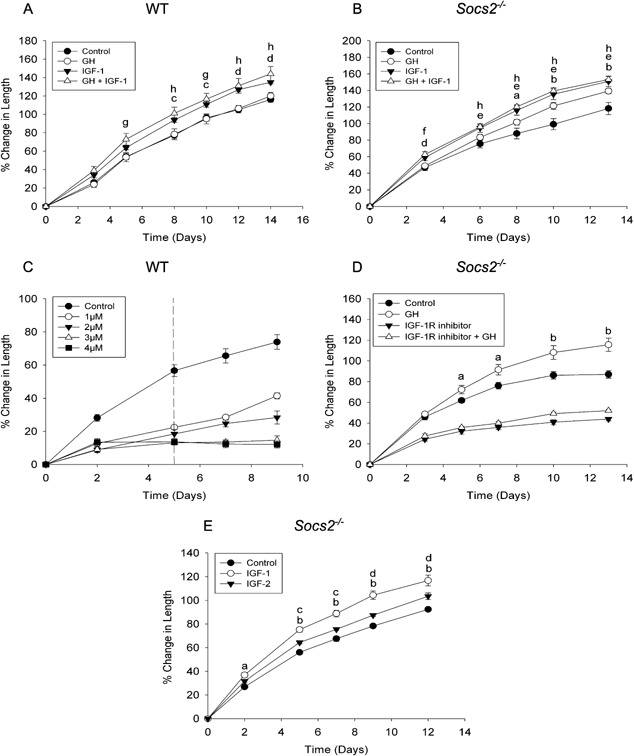
Figure 4.

Effect of IGF‐1R inhibitor, IGF‐2, and combined IGF‐I + GH on metatarsal growth. Graphs showing (A) WT and (B) Socs2‐/‐ E17 metatarsal growth in response to GH or IGF‐1 (100ng/ml) or GH + IGF‐1 over a 13–14 day period. Data are presented as mean ± SEM. Significance denoted by GH versus control a P < 0.05, b P < 0.001. IGF‐1 versus control c P < 0.05, d P < 0.01, e P < 0.001, GH+IGF‐1 versus control f P < 0.05, g P < 0.01, h P < 0.001, (n ≥ 6). (C) Graph showing WT E17 metatarsal growth in response to NVP‐AEW481 (1–4 μM) for 5 days with 4 days recovery. Data are presented as mean ± SEM. (n ≥ 6). (D) Graph showing Socs2‐/‐ E17 metatarsal growth in response to GH (100 ng/ml), NVP‐AEW481 (1 μM) or GH + NVP‐AEW481. Data are presented as mean ± SEM. Significance of GH versus control denoted by a P < 0.05, b P < 0.01, (n ≥ 6). (E) Graph showing Socs2‐/‐ E17 metatarsal growth in response to IGF‐1 or IGF‐2 (100 ng/ml). Data are presented as mean ± SEM. Significance denoted by IGF‐1 versus control a P < 0.01, b P < 0.001. IGF‐2 versus control c P < 0.05 d P < 0.01, (n ≥ 6).
