
Figure 5.
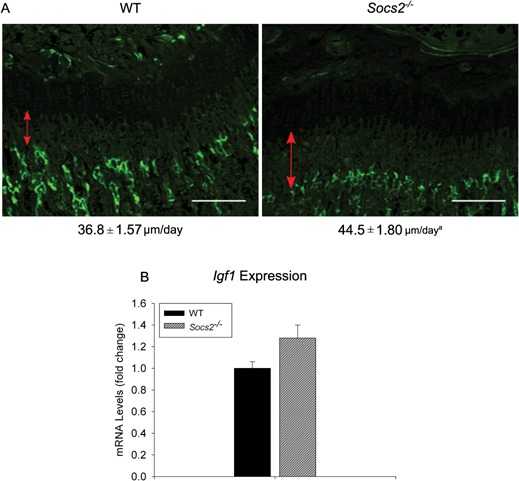
Normal IGF‐1 mRNA expression in Socs2‐/‐ growth plate. (A) Analysis of longitudinal bone growth rate by dynamic histomorphometry of 6‐week‐old male WT and Socs2‐/‐ mice. The red lines indicate the distance between the original growth plate mineralization front at the proximal end of the tibia and the fluorescing mineralization front. The numbers under the images indicate longitudinal bone formation rate (μm/day). Scale bars = 100 μm. Data presented as mean ± SEM. Significance denoted by a P < 0.05, (n ≥ 6). (B) Transcript analysis of Igf1 expression in WT and Socs2‐/‐ growth plates, micro‐dissected from 7‐week‐old male mice. Data are presented as fold change relative to WT expression as mean ± SEM, (n ≥ 3).