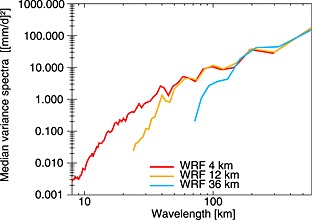
Figure 7.

Median variance spectra for surface precipitation obtained from heavy precipitation events simulated in three 8 yearlong WRF simulations (red line Δx = 4 km, yellow line Δx = 12 km, and blue line Δx = 36 km) in the headwater region of the Colorado River during December, January, and February (DJF). Both axes are logarithmically scaled (adapted from Prein et al. [2013b]). The spectra shows that the 4 km simulation has higher variances (potential added value) in short wavelengths, while the spectra are similar for wavelengths above approximately 100 km. ©Copyright 2013 AMS.
