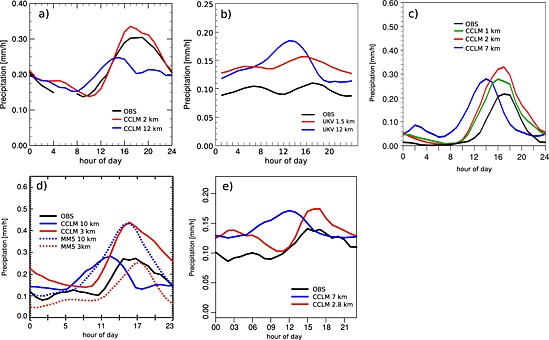
Figure 8.

Mean diurnal cycle of (a) precipitation averaged across June, July, and August (JJA) in Switzerland (Table 1, domain m) [Ban et al., 2014, ©2014. American Geophysical Union. All Rights Reserved]; (b) annually in Southern UK (Table 1, domain d) [Kendon et al., 2012, ©Copyright 2012 AMS]; (c) July 2006 in Switzerland (Table 1, domain m) [Langhans et al., 2013, ©Copyright 2013 AMS]; (d) June, July, and August (JJA) in eastern part of the Alps (Table 1, domain l) [Prein et al., 2013a]; and (e) June, July, and August (JJA) in Baden‐Württemberg, Germany (Table 1, domain j) [Fosser et al., 2014]. All CPM climate simulations show improvements in the shape (onset and peak) of the precipitation diurnal cycle compared to their corresponding LSM simulations.
