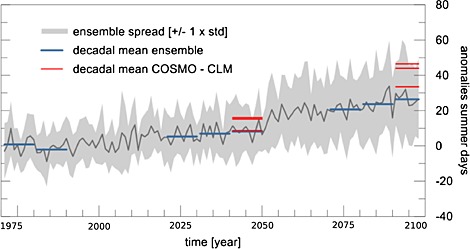
Figure 10.

Anomalies of summer days (daily maximum >25°C) based on a multimodel ensemble (3 × 3 grid cells with Δx=25 km each) data set for the period from 1971 to 2098 with respect to 1991–2000. The gray line shows the ensemble mean anomaly and the gray shaded area the ensemble spread. Blue lines indicate the decadal mean values of the anomalies of the ensemble data set. The two sets of three red lines represent decadal means for three selected artificial sites (average of (3 × 3 grid cells) of the Δx=1.3 km data set) (adapted from Junk et al. [2014]). The CPM projects summer day temperature increases that are consistently above the LSM ensemble mean.
