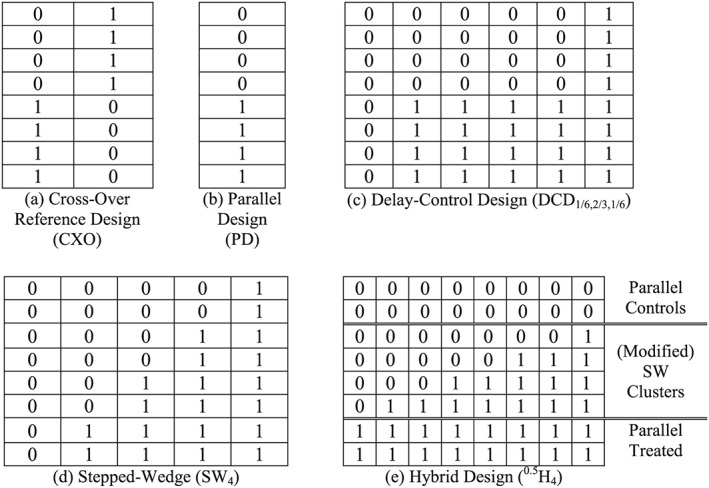
Figure 1.

Schematic for some designs with eight clusters. The horizontal direction represents time and the total duration of the study (which is the same for each design) is equally divided between the columns. The rows represent clusters. So each cell represents the observation‐times in a single cluster over one fixed time period. Treated cells are denoted by 1, and Controls by 0.
