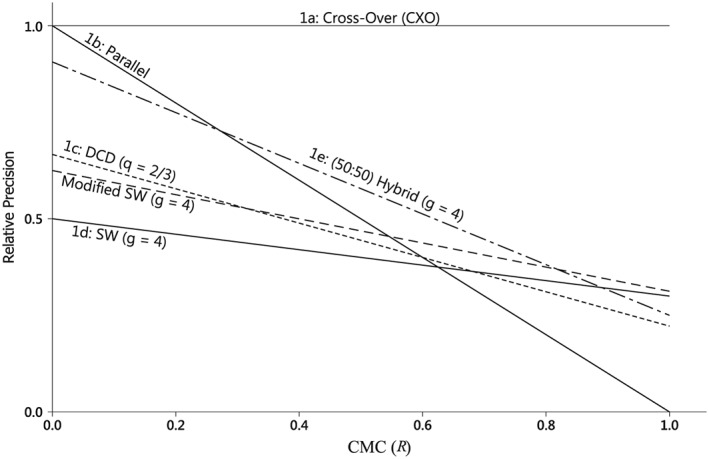
Figure 3.

Precision–ratio plots. The relative precision of some stepped designs compared to the cross‐over design is plotted against the cluster‐mean correlation parameter R. Designs 1a to 1e are those illustrated for eight clusters in Figure 1. The Modified SW design corresponds to two copies of the middle four clusters in Figure 1e.
