Fig. 3.

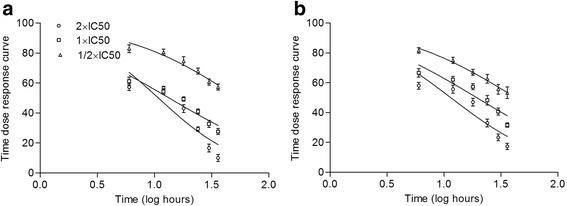
Time dose response curve of % survival 293/NFkB-Luc HEK cells (a) and RAW 264.7 cells (b) for various concentration of FXC. All the concentrations exhibited stimulation. ‘0’ point intersect indicates 100% survival

Time dose response curve of % survival 293/NFkB-Luc HEK cells (a) and RAW 264.7 cells (b) for various concentration of FXC. All the concentrations exhibited stimulation. ‘0’ point intersect indicates 100% survival