
Fig. 1.
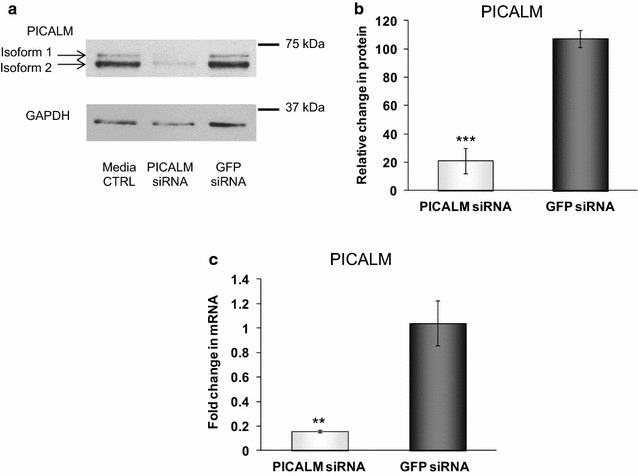
PICALM levels in H4 cells following siRNA treatments. a Representative immunoblot of PICALM after transfecting H4 cells for 48 h with control siRNA (GFP siRNA) or siRNA targeting PICALM (PICALM siRNA) and b following densitometric analysis. Data are presented as mean ± SEM as a percentage of the untreated media control after normalisation to house-keeping protein levels, n = 8, ***p < 0.001 significantly different to GFP siRNA with an unpaired Student’s t test. c PICALM mRNA expression levels using quantitative PCR, normalised to the housekeeping gene 18S and relative to the untreated cells. Data are presented as mean ± SEM, n = 6, **p < 0.01 significantly different to GFP siRNA with Mann–Whitney-U