
Fig. 3.
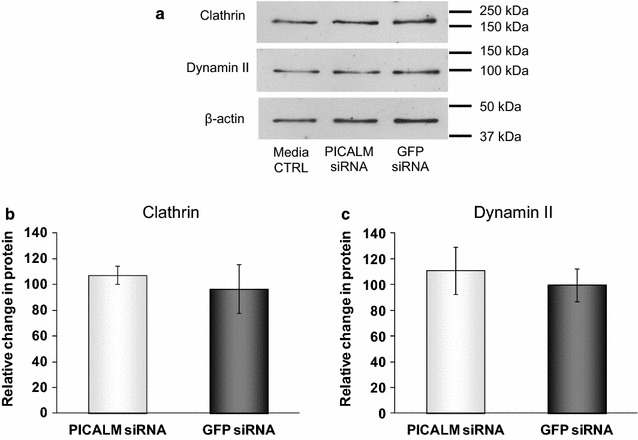
Clathrin and dynamin II protein expression levels following siRNA treatments. a Representative immunoblots of clathrin and dynamin II after incubating H4 cells for 48 h with media, control siRNA (GFP siRNA) or siRNA targeting PICALM (PICALM siRNA), b densitometric analysis of clathrin, n = 6 and c densitometric analysis of dynamin II, n = 4. Data are presented as mean ± SEM as a percentage of the untreated media control after normalisation to house-keeping protein levels