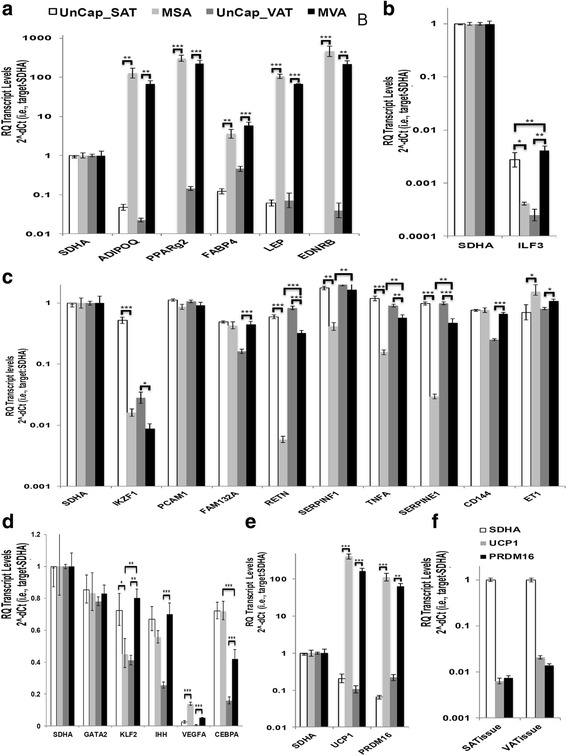
Fig. 4.

Expression of cell-type specific transcripts in MA nuclei captured from VAT and SAT. qRT-PCR analysis was performed on cDNA prepared from captured adipocyte nuclei from VAT (MVA) and SAT (MSA) and uncaptured nuclei (UnCap-VAT and -SAT). Nuclear mRNAs were assayed for transcripts encoding (a) MA markers, (b, c, d) potential markers for leukocytes, endothelial cells, and progenitor cells, (e) markers of thermogenic beige/bright adipocytes. f The levels of PRDM16 and UCP1 transcripts in whole VAT and SAT tissue were also assayed. SDHA was used as the endogenous control as it was nearly equivalently expressed in all samples relative to the amount of input cDNA. Bar graphs show the Mean ± SEM with p < 0.05 *, p < 0.01 **, p < 0.001 *** indicated for selected comparisons
