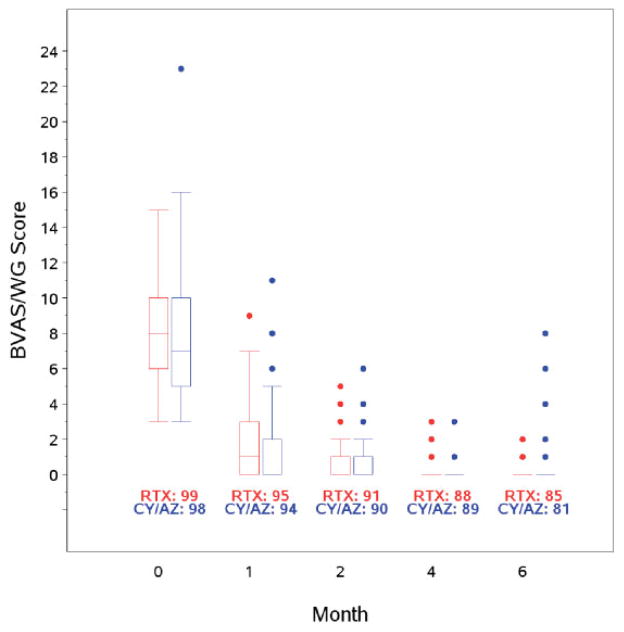
Figure 2.
Disease activity by treatment group. Data are shown as box plots. Each box represents the upper and lower interquartile range (IQR). Lines inside the boxes represent the median. Whiskers represent 1.5 times the upper and lower IQRs. Circles indicate outliers. At the 4-month and 6-month time points, remission had been achieved in most patients. BVAS/WG = Birmingham Vasculitis Activity Score for Wegener’s Granulomatosis; RTX = rituximab; CY/AZ = cyclophosphamide followed by azathioprine.

