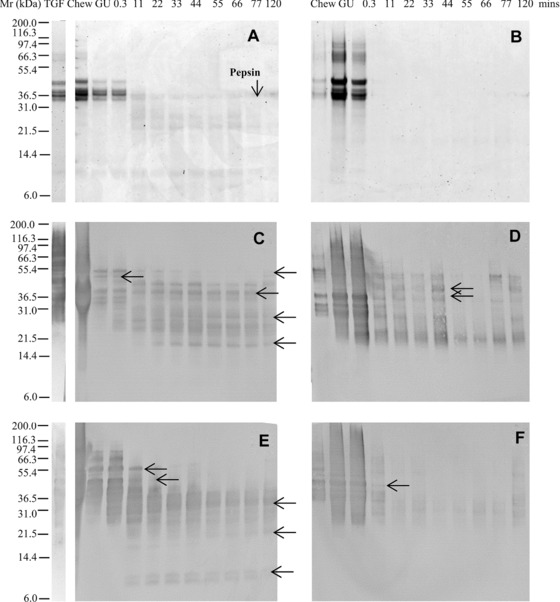
Figure 1.

Simulated gastric digestion of a total gliadin fraction from wheat undertaken using a low pepsin protocol. Soluble (A, C, E) and insoluble (B, D, F) fractions of digests analysed by SDS‐PAGE (A, B), immunoblotting (C–F) using mAbs IFRN 0610 (C, D; brightened by + 40%) and 0065 (E, F). Selected bands (arrowed) were subjected to densitometric analysis (Supporting Information Table 3) and used for kinetic analysis. Soluble protein volumes loaded accounted for dilution factor between digestive phases whereas extracted insoluble protein samples were loaded in equivalent volumes. Pepsin was identified on the basis of its Mr defined by SDS PAGE analysis of the digestion enzymes (data not shown).
