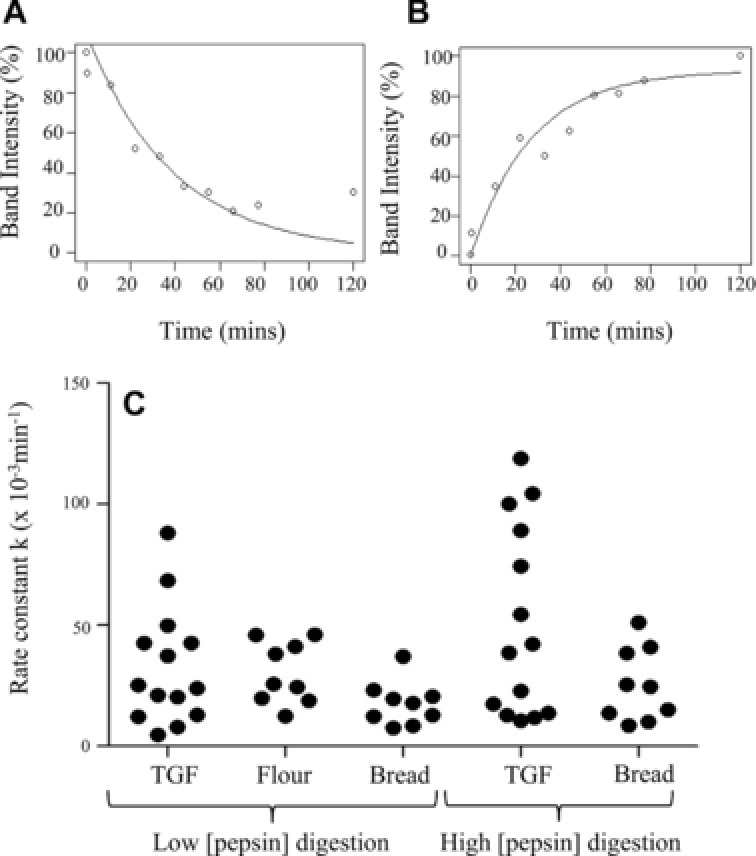
Figure 4.

Kinetics of selected prolamins under different digestion conditions. Kinetics (rate constant k (min−1) estimated from the fitting of an exponential curve) of the disappearance of substrate protein or appearance of product at “high” or “low” pepsin: protein ratios. Prolamins were reactive with mAb 0610 or 0065, present in digest immunoblots of matrices total gliadin fraction (TGF), flour or bread. (A) Kinetic analysis example from flour digestion, Mr 44 kDa insoluble substrate, k = 25.66 × 10⁻³min−1. (B) Kinetic analysis example from bread digestion (low pepsin), Mr 20 kDa soluble product, k = 37.09 × 10⁻³min−1. (C) Scatter plot of combined kinetic analysis for digests.
