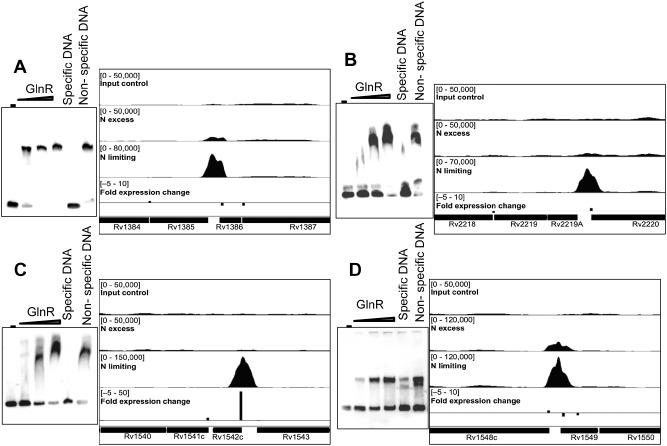
Figure 3.

Novel GlnR binding sites identified upstream of differentially expressed genes, with corresponding EMSA to confirm specific GlnR binding.
EMSA were performed by incubating increasing amounts of His‐GlnR recombinant protein with labelled DNA corresponding to the promoter regions of the genes downstream of the GlnR binding site. GlnR binding was visualised in IGV. The top track represents input control DNA, the second track represents GlnR binding in nitrogen excess and the third track represents GlnR binding in nitrogen limiting conditions. Bar height is representative of fold change in gene expression in the wild type compared with the glnR KO mutant in nitrogen limitation. Levels of gene expression are indicated in the bottom track. (A) Peak 13, Rv1386 (PE15); (B) peak 20, Rv2219A; (C) peak 17, Rv1542c (glbN); (D) peak 18, Rv1548c (PPE22). The negative control Rv1360 DNA showed no GlnR binding (Fig. S4).
