
Figure 13.
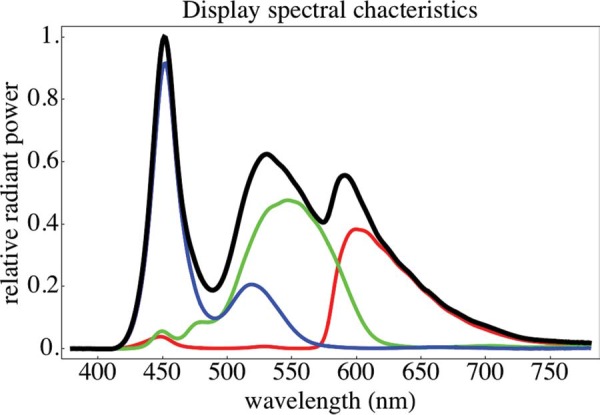
The radiant power spectra (normalized to the maximum of the combined-white-spectrum) of the red, green, and blue color channels of the display. Spectral resolution is 1 nm, random error of relative radiant power within about ±1%. These spectra are relevant if one desires to explain our results as due to chromatic aberrations of the eye optics. As explained in the main text, we have compelling reasons not to accept such an explanation. The color channels are drawn in red, green, and blue, the combined white is indicated with the black curve.