
Figure 15.
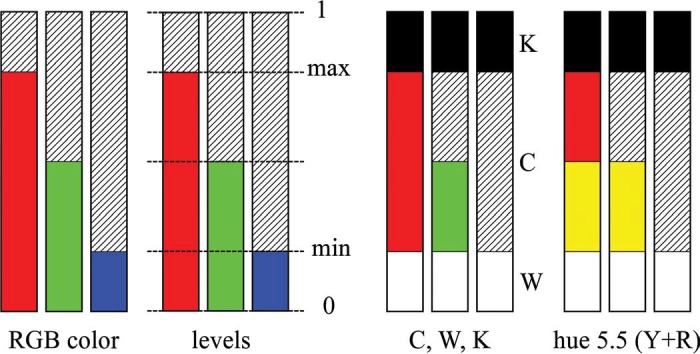
An example of the Ostwald analysis of RGB colors. At left, an RGB color, presented as a bar diagram. The second subfigure shows the relevant levels, the third the color, white, and black contents. In the fourth subfigure, the full color has been split into the primary (here red), and the associated secondary component (here yellow). The color is orange, an equal mixture of red and yellow, with 20% black and 20% white. The Ostwald designation is {5.5, {0.6, 0.2, 0.2}}.