Figure 1.

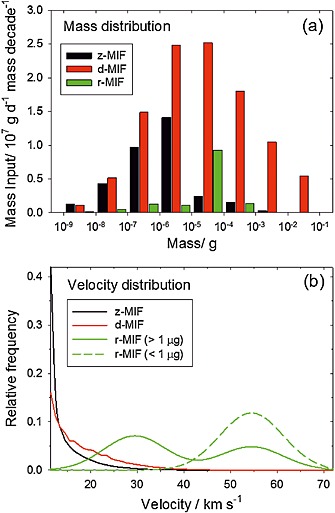
(a) Histogram of the particle mass distributions and (b) entry velocity distributions for the z‐MIF (black), d‐MIF (red), and r‐MIF (green) models.

(a) Histogram of the particle mass distributions and (b) entry velocity distributions for the z‐MIF (black), d‐MIF (red), and r‐MIF (green) models.