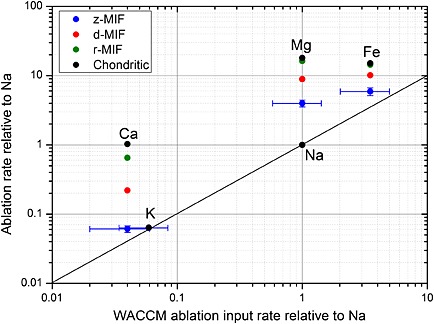
Figure 3.

Ablation rates for Fe, Ca, Mg, and K relative to Na, produced by the z‐MIF, d‐MIF, and r‐MIF models, plotted against the relative input rates required to model the global metal atom layers in the MLT. The solid line is the 1:1 correlation line. The error bars on the z‐MIF points indicate the uncertainty in the measured ratios (horizontal) and the cosmic dust melting point (vertical).
