Figure 3.

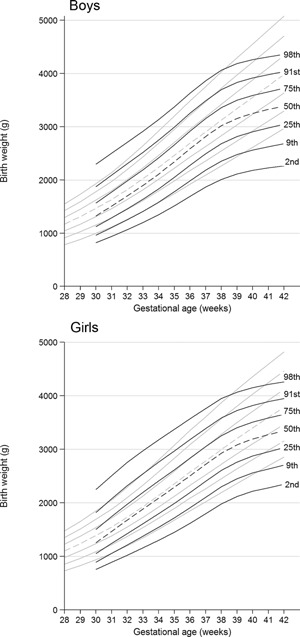
Birth weight centiles for boys and girls: Down syndrome (black lines) compared with revised UK‐WHO growth charts (gray lines) [Cole et al., [Link]].

Birth weight centiles for boys and girls: Down syndrome (black lines) compared with revised UK‐WHO growth charts (gray lines) [Cole et al., [Link]].