
Figure 3.
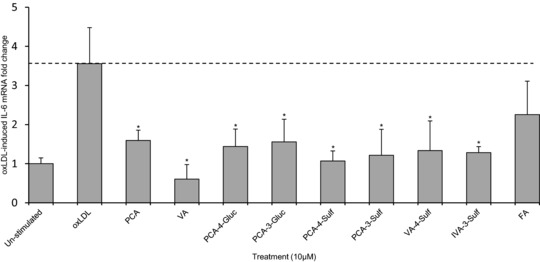
Change in OxLDL‐stimulated IL‐6 mRNA in HUVECs co‐incubated with C3G and phenolic metabolites at 10 μM or oxLDL controls for 24 h. All graphical data expressed as mean fold change (± SD, n = 3) of un‐stimulated (basal) IL‐6 mRNA levels. *p ≤ 0.05 (ANOVA with Tukey post‐hoc) relative to oxLDL‐stimulated control. PCA, protocatechuic acid; VA, vanillic acid; PCA‐3‐Sulf, PCA‐3‐sulfate; PCA‐4‐Sulf, PCA‐4‐sulfate; VA‐4‐Sulf, VA‐4‐sulfate; IVA‐3‐Sulf, IVA‐3‐sulfate; FA, ferulic acid.