
Figure 6.
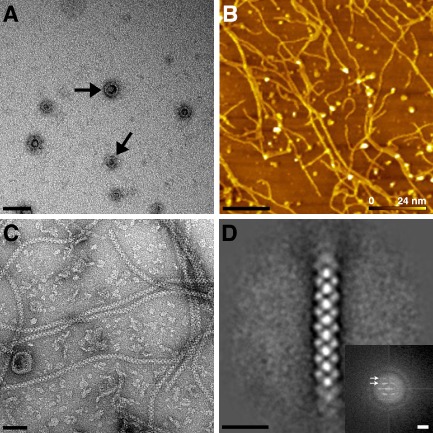
EM and AFM of CotV–W.
A. Negatively stained image of CotW particles after E scherichia coli overexpression and purification. Scale bar represents 100 nm.
B. AFM topograph of CotV–CotW on a silicon surface. Heights above the surface are colour coded. Scale bar represents 1 μm.
C. Electron micrograph of negatively stained CotV–CotW co‐expression showing helical fibres. Scale bar represents 50 nm.
D. Single‐particle average of 137 fibre segments. Scale bar represents 20 nm. Inset shows computed diffraction from raw image (right) and averaged image (left). Arrows indicate layer lines. Scale bar represents 0.3 nm−1. Images (B) and (C) were obtained after protein purification from two independent cell batches.