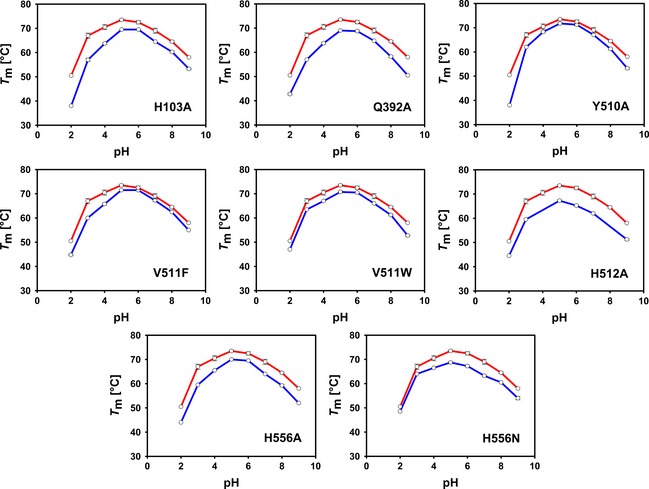
Figure 2.

Melting temperatures T m obtained from Thermo FAD experiments using 65 μm Am PDH and its variants in 40 mm Britton‐Robinson buffer (pH 2–9). The upper red line represents the T m value of wild‐type recombinant Am PDH and the lower blue line is the variant indicated. Because of limited amounts of H512A available, data could only be recorded for pH 2, 3, 5, 6, 7 and 9. Data shown are the mean ± SD value of at least two independent experiments.
