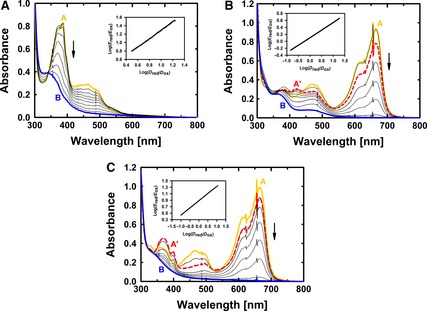
Figure 8.

Determination of reduction potentials according to Massey's method 70 for pyranose dehydrogenase from A. meleagris (A), variant H103A (B) and variant H556A (C). Spectral line A (uppermost solid line in yellow) represents the fully oxidized enzyme and dye, whereas spectral line B (lowest solid line in blue) represents fully reduced enzyme and dye. In (B) and (C), the dashed red line A′ represents the maximum of an occurring semiquinone intermediate with a maximum absorbance at 422 nm (B) or 368 nm (C). The inset in (A) shows the reduction of phenazine methosulfate (dye, ‘D’) monitored at 387 nm and the reduction of Am PDH (enzyme, ‘E’) monitored at 463 nm, allowing the calculation of the ratios between reduced and oxidized species (E red/E ox and D red/D ox). of Am PDH was calculated to be +92 ± 3 mV. The inset in (B) shows the reduction of methylene blue (‘D’) monitored at 664 nm and the reduction of variant H103A (‘E’) monitored at 460 nm. of variant H103A was calculated to be +63 ± 3 mV. The inset in (C) shows the reduction of methylene blue (D) monitored at 664 nm and the reduction of variant H556A (E) monitored at 465 nm. of variant H556A was calculated to be +84 ± 4 mV. An overview of the obtained data is provided in Table 7.
