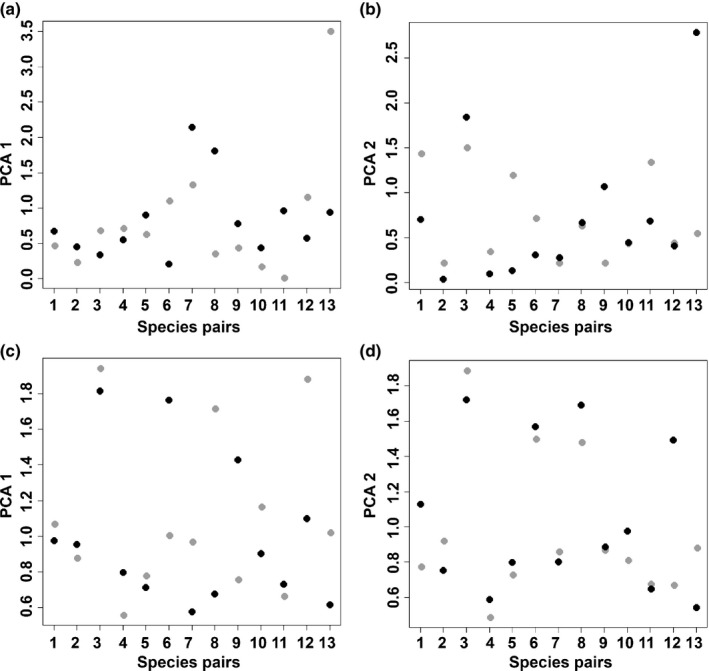
Figure 3.

Pairwise relations of changes of optimal niche position (a, b) and niche breadth (c, d) during invasion. For changes in niche optima, a value close to 0 indicates little change in niche optimum between native and alien ranges. Concerning niche breadth, a value > 1 indicates broadening of the niche during invasion and a value smaller than 1 indicates contraction. The first two axes of a principal components analysis (PCA) are shown; grey, apomictic species; black, sexual species. Numbers refer to the pair ID (Table 1).
