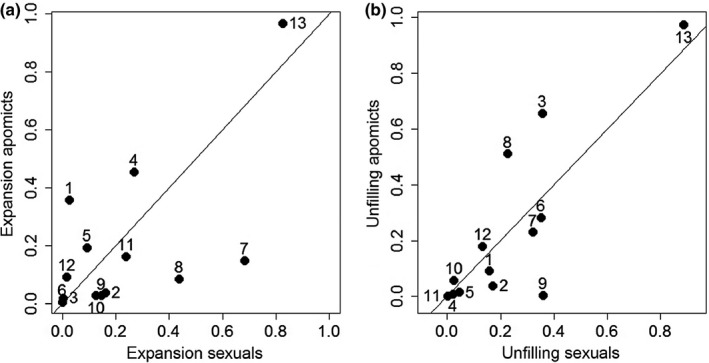
Figure 4.

Relative expansion and unfilling for sexual (x‐axis) and apomictic (y‐axis) species. Values close to the 45° line indicate similar niche dynamics in the sexual and apomictic species of a particular congeneric (or contribal) pair, while values closer to the y‐axis indicate stronger niche change in the apomictic species, and values closer to the x‐axis indicate stronger niche change in the sexual species. Numbers refer to the pair ID in Table 1.
