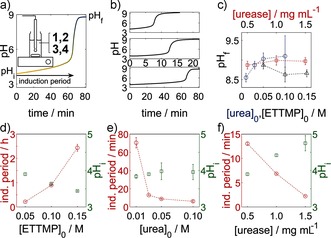
Figure 2.

Temporal control of thiol–acrylate gelation with the urea–urease reaction. a) Typical pH–time curve with the induction period, initial pH value after mixing, and final pH value indicated. Gelation occurred rapidly above pH 8. The inset shows the experimental set‐up (see the Supporting Information). b) Series of pH–time curves with decreasing urea concentration (0.05 (top), 0.03 (middle), 0.01 m (bottom)). c) Average final pH value as a function of the initial concentrations. d–f) Induction periods and average initial pH values after mixing. The fixed initial concentrations were [urea]0=0.03 m, [ETTMP]0=0.05 m, and [urease]0=0.5 mg mL−1 (17 units mL−1); the ETTMP/PEGDA molar ratio was 2:3; T=25 °C. Standard deviations from three repeat measurements are shown.
