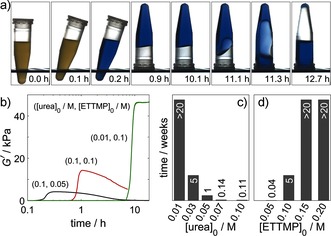
Figure 4.

Hydrogel degradation. a) Series of images showing the return of the thiol–acrylate gel to the liquid state, in which [urea]=0.09 m, [urease]=0.85 mg mL−1 (29 units mL−1), [ETTMP]0=0.06 m, and [PEGDA]0=0.08 m. b) Dynamic rheology with storage modulus G′ as a function of time. c,d) Time to return to the liquid state as a function of the urea (c) and ETTMP concentrations (d). Concentrations of other components: [ETTMP]0=0.1 m, [urea]0=0.03 m, [urease]=0.5 mg mL−1 (17 units mL−1); the ETTMP/PEGDA molar ratio was 2:3; T=23 °C.
