
Figure 2.
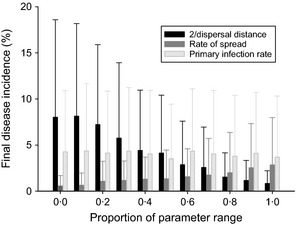
Comparisons of the effects of parameter ranges for dispersal distance (α), rate of spread () and primary infection rate (λ) on final disease incidence in a field with a high (80–110 individuals per plant) whitefly population. The x‐axis measures the value for the appropriate parameter as a proportion of the total range found in Table 1. All other parameters are chosen from a uniform distribution given in Table 1. The bar gives the mean and the whiskers one standard deviation for 300 runs of the model.