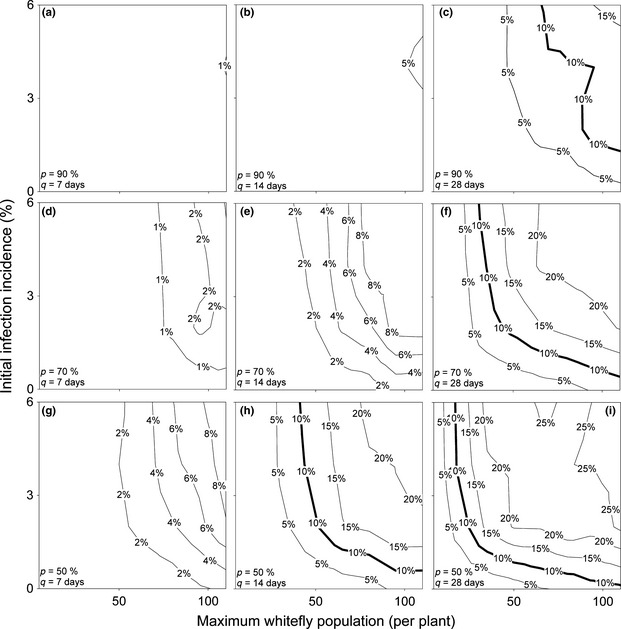
Figure 3.

Mean final incidence of disease (%) in cuttings distributed to growers at harvest over a range of parameters for a low disease pressure system. For each plot, x‐axis is the maximum whitefly numbers (per plant) and y‐axis the size of an initial source of infection (%). Roguing interval varies across columns, where the interval (q) given below is for the first 2 months after planting, after which the interval doubles. Roguing occurs weekly in column 1 (plots a, d, g), fortnightly in column 2 (plots b, e, h) and monthly in column 3 (plots c, f, i). Roguing success, or the probability of successfully detecting a plant with symptoms (P), varies across rows, and is 90% in row 1 (plots a–c), 70% in row 2 (plots d–f) and 50% in row 3 (plots g–i). Bold lines represent the guideline maximum infection level of 10%, as suggested by the 5CP project, in the cuttings Dr J. P. Legg, IITA, Tanzania, personal communication.
