
Figure 4.
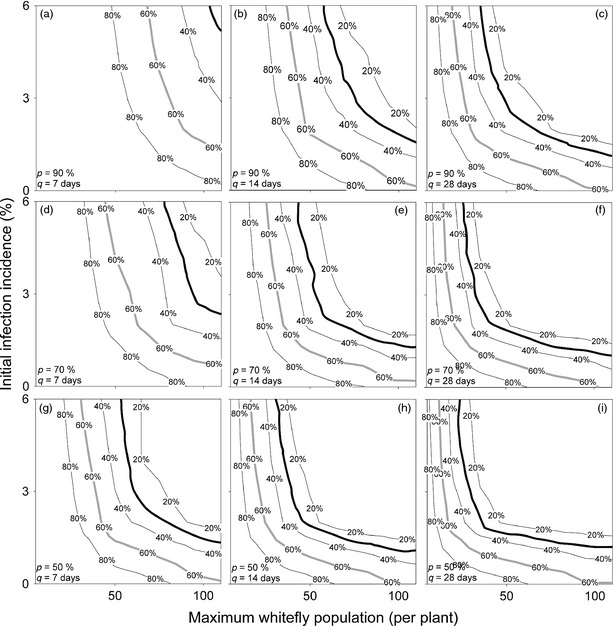
Mean number of plants available at harvest to provide cuttings (as a percentage of the initial plant population) to distribute to growers, considered over a range of parameters for a low disease pressure system. x‐axes, y‐axes, columns and rows vary as described in Figure 3. Bold grey lines represents the minimum percentage of plants remaining in a 5 acre field at harvest to distribute sufficient cuttings to plant 30 acres of fields if multiplication rates are low (10‐fold), while bold black lines, at 30% of the population, represent the same for high multiplication rates (20‐fold).