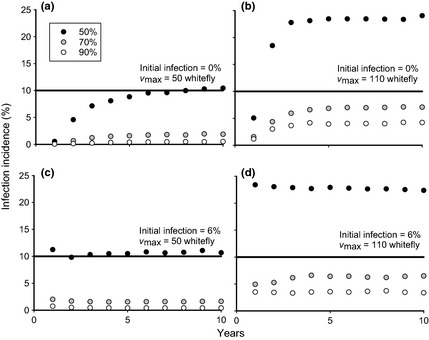
Figure 5.

Degeneration of the planting material over a 10 year period. The y‐axes measure the percentage of infected cuttings at the beginning of each planting cycle, while for each set of symbols in each plot the roguing success rate varies as described in the key. The maximum number of whitefly per plant is either 50 (plots a, c) or 110 (plots b, d). The infection level in the initial cuttings planted for the first season is either 0% (plots a, b) or 6% (plots c, d). Roguing occurs fortnightly for the first 2 months after planting and monthly thereafter, as is currently practised in the field. All other parameter ranges may be found in Table 1. Bold lines represents the guideline maximum infection level in the cuttings.
