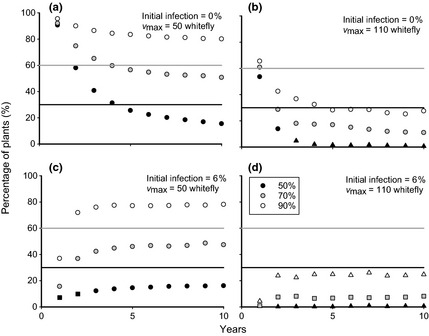
Figure 6.

Percentage of plants available for cutting distribution at the end of each season over a 10 year period. For each set of symbols in each plot the roguing success rate varies as described in the key. Circles represent years in which sufficient cuttings are produced to replant the multiplication field itself, squares represent years in which the field could not be fully replanted if the multiplication rate was 10‐fold, and triangles represent years in which the field could not be fully replanted if the multiplication rate was 20‐fold. It is assumed that sufficient cuttings are always available for replanting during the decade‐long period. The maximum number of whitefly per plant and the infection level in the initial cuttings vary as in Figure 5, with the same set of parameter values and roguing at the same interval. Bold grey lines represents the minimum proportion of plants remaining in a 5 acre field at harvest to distribute sufficient cuttings to plant 30 acres of fields if multiplication rates are high (20‐fold), while bold black lines represent the same for low multiplication rates (10‐fold).
