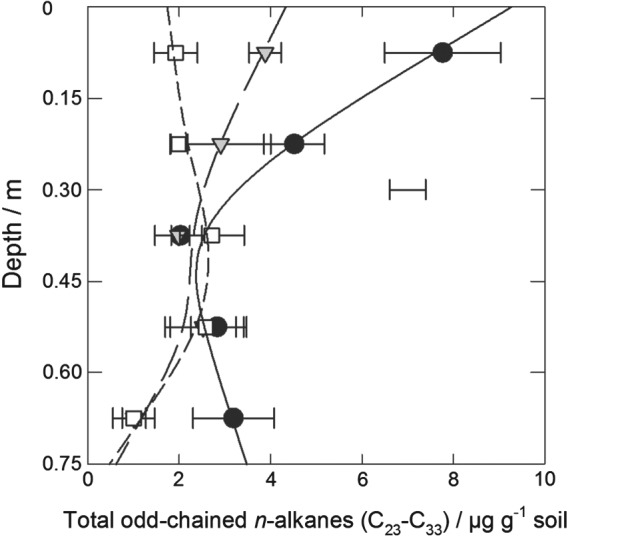
Figure 4.

Concentration of total odd long‐chain n‐alkanes (from C23 to C33) in soil under long‐term grass (black circles, solid line), arable (1949–; grey triangles, long‐dashed line) and fallow (1959–; white squares, short‐dashed line) treatments in 2008. The data points show the treatment mean and standard error of the mean (n = 3) and the lines derive from residual maximum likelihood (REML) analysis with spline models (models (4), (5), (6)). The separate bar shows the average standard error of a difference of means (SED) for the model (see Table 3 for statistical analysis).
